introduction Link to heading
- os: ubuntu 14.04
- elasticsearch: 2.2.x
- logstash: 2.2.x
- kibana: 4.5.x
what does it like for ELK stack
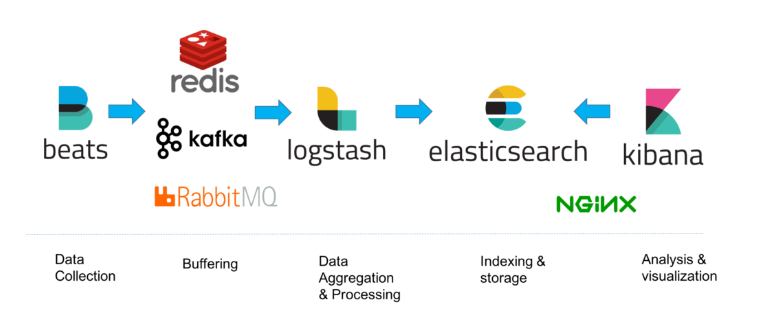
- client servers installed with filebeat sends logs to elk server
- elk/logstash server process and index log, store logs, search and visualize and using nginx to do reverse proxy
installations Link to heading
install java 8 Link to heading
sudo add-apt-repository -y ppa:webupd8team/java
sudo apt-get update
sudo apt-get -y install oracle-java8-installer
install elasticsearch Link to heading
wget -qO - https://packages.elastic.co/GPG-KEY-elasticsearch | sudo apt-key add -
echo "deb http://packages.elastic.co/elasticsearch/2.x/debian stable main" | sudo tee -a /etc/apt/sources.list.d/elasticsearch-2.x.list
sudo apt-get update
sudo apt-get install -y elasticsearch
elasticsearch is installed, now configurations.
sudo vim /etc/elasticsearch/elasticsearch.yml
this is where to configure elasticsearch. we care about who can access elasticsearch. in order to keep it safe, we only allow localhost to access elasticsearch so that outsider cannot access elasticsearch instance, hence the data.
to do this, find network.host keyword, uncomment the line:
...
  network.host: localhost
...
save and exit
sudo service elasticsearch restart

# start elasticsearch when boot up and priority of starting and killing
sudo update-rc.d elasticsearch defaults 95 10
``

### install kibana

```bash
echo "deb http://packages.elastic.co/kibana/4.5/debian stable main" | sudo tee -a /etc/apt/sources.list.d/kibana-4.5.x.list
sudo apt-get update
sudo apt-get -y install kibana
next, like elasticsearch, we need to configure kibana
open config file
sudo vim /opt/kibana/config/kibana.yml
find server.host keyword and replace 0.0.0.0 into localhost
server.host: "localhost"
save and exit
sudo update-rc.d kibana defaults 96 9
sudo service kibana start
install nginx Link to heading
sudo apt-get install nginx apache2-utils

# create admin user named "kibanaadmin", that can access kibana web interface
sudo htpasswd -c /etc/nginx/htpasswd.users kibanaadmin
now configure nginx
sudo vim /etc/nginx/sites-available/default
server {
    listen 80;

    server_name localhost;

    auth_basic "Restricted Access";
    auth_basic_user_file /etc/nginx/htpasswd.users;

    location / {
        proxy_pass http://localhost:5601;
        proxy_http_version 1.1;
        proxy_set_header Upgrade $http_upgrade;
        proxy_set_header Connection 'upgrade';
        proxy_set_header Host $host;
        proxy_cache_bypass $http_upgrade;
    }
}
optional: in case you meet fail to bind error, please follow this
sudo service nginx restart
now if you go to localhost, then you will see kibana welcome page.
install logstash Link to heading
echo 'deb http://packages.elastic.co/logstash/2.2/debian stable main' | sudo tee /etc/apt/sources.list.d/logstash-2.2.x.list
sudo apt-get update
sudo apt-get install logstash
generating SSL certificates Link to heading
Since we are going to use Filebeat to ship logs from our Client Servers to our ELK Server, we need to create an SSL certificate and key pair. The certificate is used by Filebeat to verify the identity of ELK Server. Create the directories that will store the certificate and private key with the following commands:
sudo mkdir -p /etc/pki/tls/certs
sudo mkdir /etc/pki/tls/private
Now you have two options for generating your SSL certificates. If you have a DNS setup that will allow your client servers to resolve the IP address of the ELK Server, use Option 2. Otherwise, Option 1 will allow you to use IP addresses.
this post will only introduce option 1, that is using ip address
sudo vi /etc/ssl/openssl.cnf
find [v3_ca] section and add one line below
...
subjectAltName = IP: ELK_server_private_IP
...
save and exit
hint: how to find elk server private ip address
ifconfig eth0 | grep "inet addr:" | cut -d ":" -f2 | cut -d " " -f1
# generate ssl certificate in appropriate locations (/etc/pki/tls/)

cd /etc/pki/tls
sudo openssl req -config /etc/ssl/openssl.cnf -x509 -days 3650 -batch -nodes -newkey rsa:2048 -keyout private/logstash-forwarder.key -out certs/logstash-forwarder.crt
configure logstash Link to heading
Logstash configuration files are in the JSON-format, and reside in /etc/logstash/conf.d. The configuration consists of three sections: inputs, filters, and outputs.
create input conf by
sudo vim /etc/logstash/conf.d/02-beats-input.conf
input {
  beats {
    port => 5044
    ssl => true
    ssl_certificate => "/etc/pki/tls/certs/logstash-forwarder.crt"
    ssl_key => "/etc/pki/tls/private/logstash-forwarder.key"
  }
}
create filter conf by
sudo vim /etc/logstash/conf.d/10-syslog-filter.conf
filter {
  if [type] == "syslog" {
    grok {
      match => { "message" => "%{SYSLOGTIMESTAMP:syslog_timestamp} %{SYSLOGHOST:syslog_hostname} %{DATA:syslog_program}(?:\[%{POSINT:syslog_pid}\])?: %{GREEDYDATA:syslog_message}" }
      add_field => [ "received_at", "%{@timestamp}" ]
      add_field => [ "received_from", "%{host}" ]
    }
    syslog_pri { }
    date {
      match => [ "syslog_timestamp", "MMM  d HH:mm:ss", "MMM dd HH:mm:ss" ]
    }
  }
}
create output conf by
sudo vim /etc/logstash/conf.d/30-elasticsearch-output.conf
    output {
      elasticsearch {
        hosts => ["localhost:9200"]
        sniffing => true
        manage_template => false
        index => "%{[@metadata][beat]}-%{+YYYY.MM.dd}"
        document_type => "%{[@metadata][type]}"
      }
    }
the way to check logstash configuration is
sudo service logstash configtest
if you see Configuration OK, it means there is no syntax error
sudo service logstash restart
sudo update-rc.d logstash defaults 96 9
(optional) load kibana dashboards Link to heading
Elastic provides several sample Kibana dashboards and Beats index patterns that can help you get started with Kibana
cd ~
curl -L -O https://download.elastic.co/beats/dashboards/beats-dashboards-1.1.0.zip
sudo apt-get -y install unzip
unzip beats-dashboards-*.zip
cd beats-dashboards-*
./load.sh
we can see some index pattern we just loaded
- [packetbeat-]YYYY.MM.DD
- [topbeat-]YYYY.MM.DD
- [filebeat-]YYYY.MM.DD
- [winlogbeat-]YYYY.MM.DD
(optional) load filebeat index template in elasticsearch Link to heading
(optional) copy elk cert to client server Link to heading
copy elk cert to client server in order to establish communication. because our model is single node, this is not mandatory.
install filebeat on client server Link to heading
notice that it must happen at client server
echo "deb https://packages.elastic.co/beats/apt stable main" |  sudo tee -a /etc/apt/sources.list.d/beats.list
wget -qO - https://packages.elastic.co/GPG-KEY-elasticsearch | sudo apt-key add -
sudo apt-get update
sudo apt-get install filebeat
next we configure filebeat
sudo vim /etc/filebeat/filebeat.yml
near top of the file, we will find prospectors section. what we do following is to send only syslog and auth.log to logstash
we do the following
...
      paths:
        - /var/log/auth.log
        - /var/log/syslog
#        - /var/log/*.log
...
...
      document_type: syslog
...
### Logstash as output
  logstash:
    # The Logstash hosts
    hosts: ["ELK_server_private_IP:5044"]
# directly under hosts section we add
    bulk_max_size: 1024
...
...
    tls:
      # List of root certificates for HTTPS server verifications
      certificate_authorities: ["/etc/pki/tls/certs/logstash-forwarder.crt"]
save and exit
sudo service filebeat restart
sudo update-rc.d filebeat defaults 95 10
test filebeat installation Link to heading
on elk server, we verify if we receive data by searching filebeat.
curl -XGET 'http://localhost:9200/filebeat-*/_search?pretty'
If your output shows 0 total hits, Elasticsearch is not loading any logs under the index you searched for, and you should review your setup for errors.
go to kibana dashboard Link to heading
if the first time you go to kibana dashboard, it asked you to select a default index pattern. after your selection, and star it, go to Discover, and you find your log.